
Drop in your imager's export folder. Blotto™ finds the lanes and bands, subtracts background, flags saturated bands, and normalizes to your loading control or total protein, then exports a PDF report showing every band it measured and how. No ImageJ. No spreadsheets.
Works with ChemiDoc, iBright, Odyssey and more | 14 days free · nothing to install
Built by a scientist, for scientists.
No vendor software, no converting files, no locked-in instrument. Drop in the export and go.
Not sure about yours? Email admin@blotto.app with one file and we'll check it for you.
The trustworthy tools are expensive and locked to one instrument. Everyone else eyeballs band intensity or wrestles ImageJ into giving a number: hand-tuned, unrecorded, and different from one person, day, or figure to the next. Two trainees measure the same immunoblot and disagree.
Blotto fixes that: accessible, consistent, transparent.
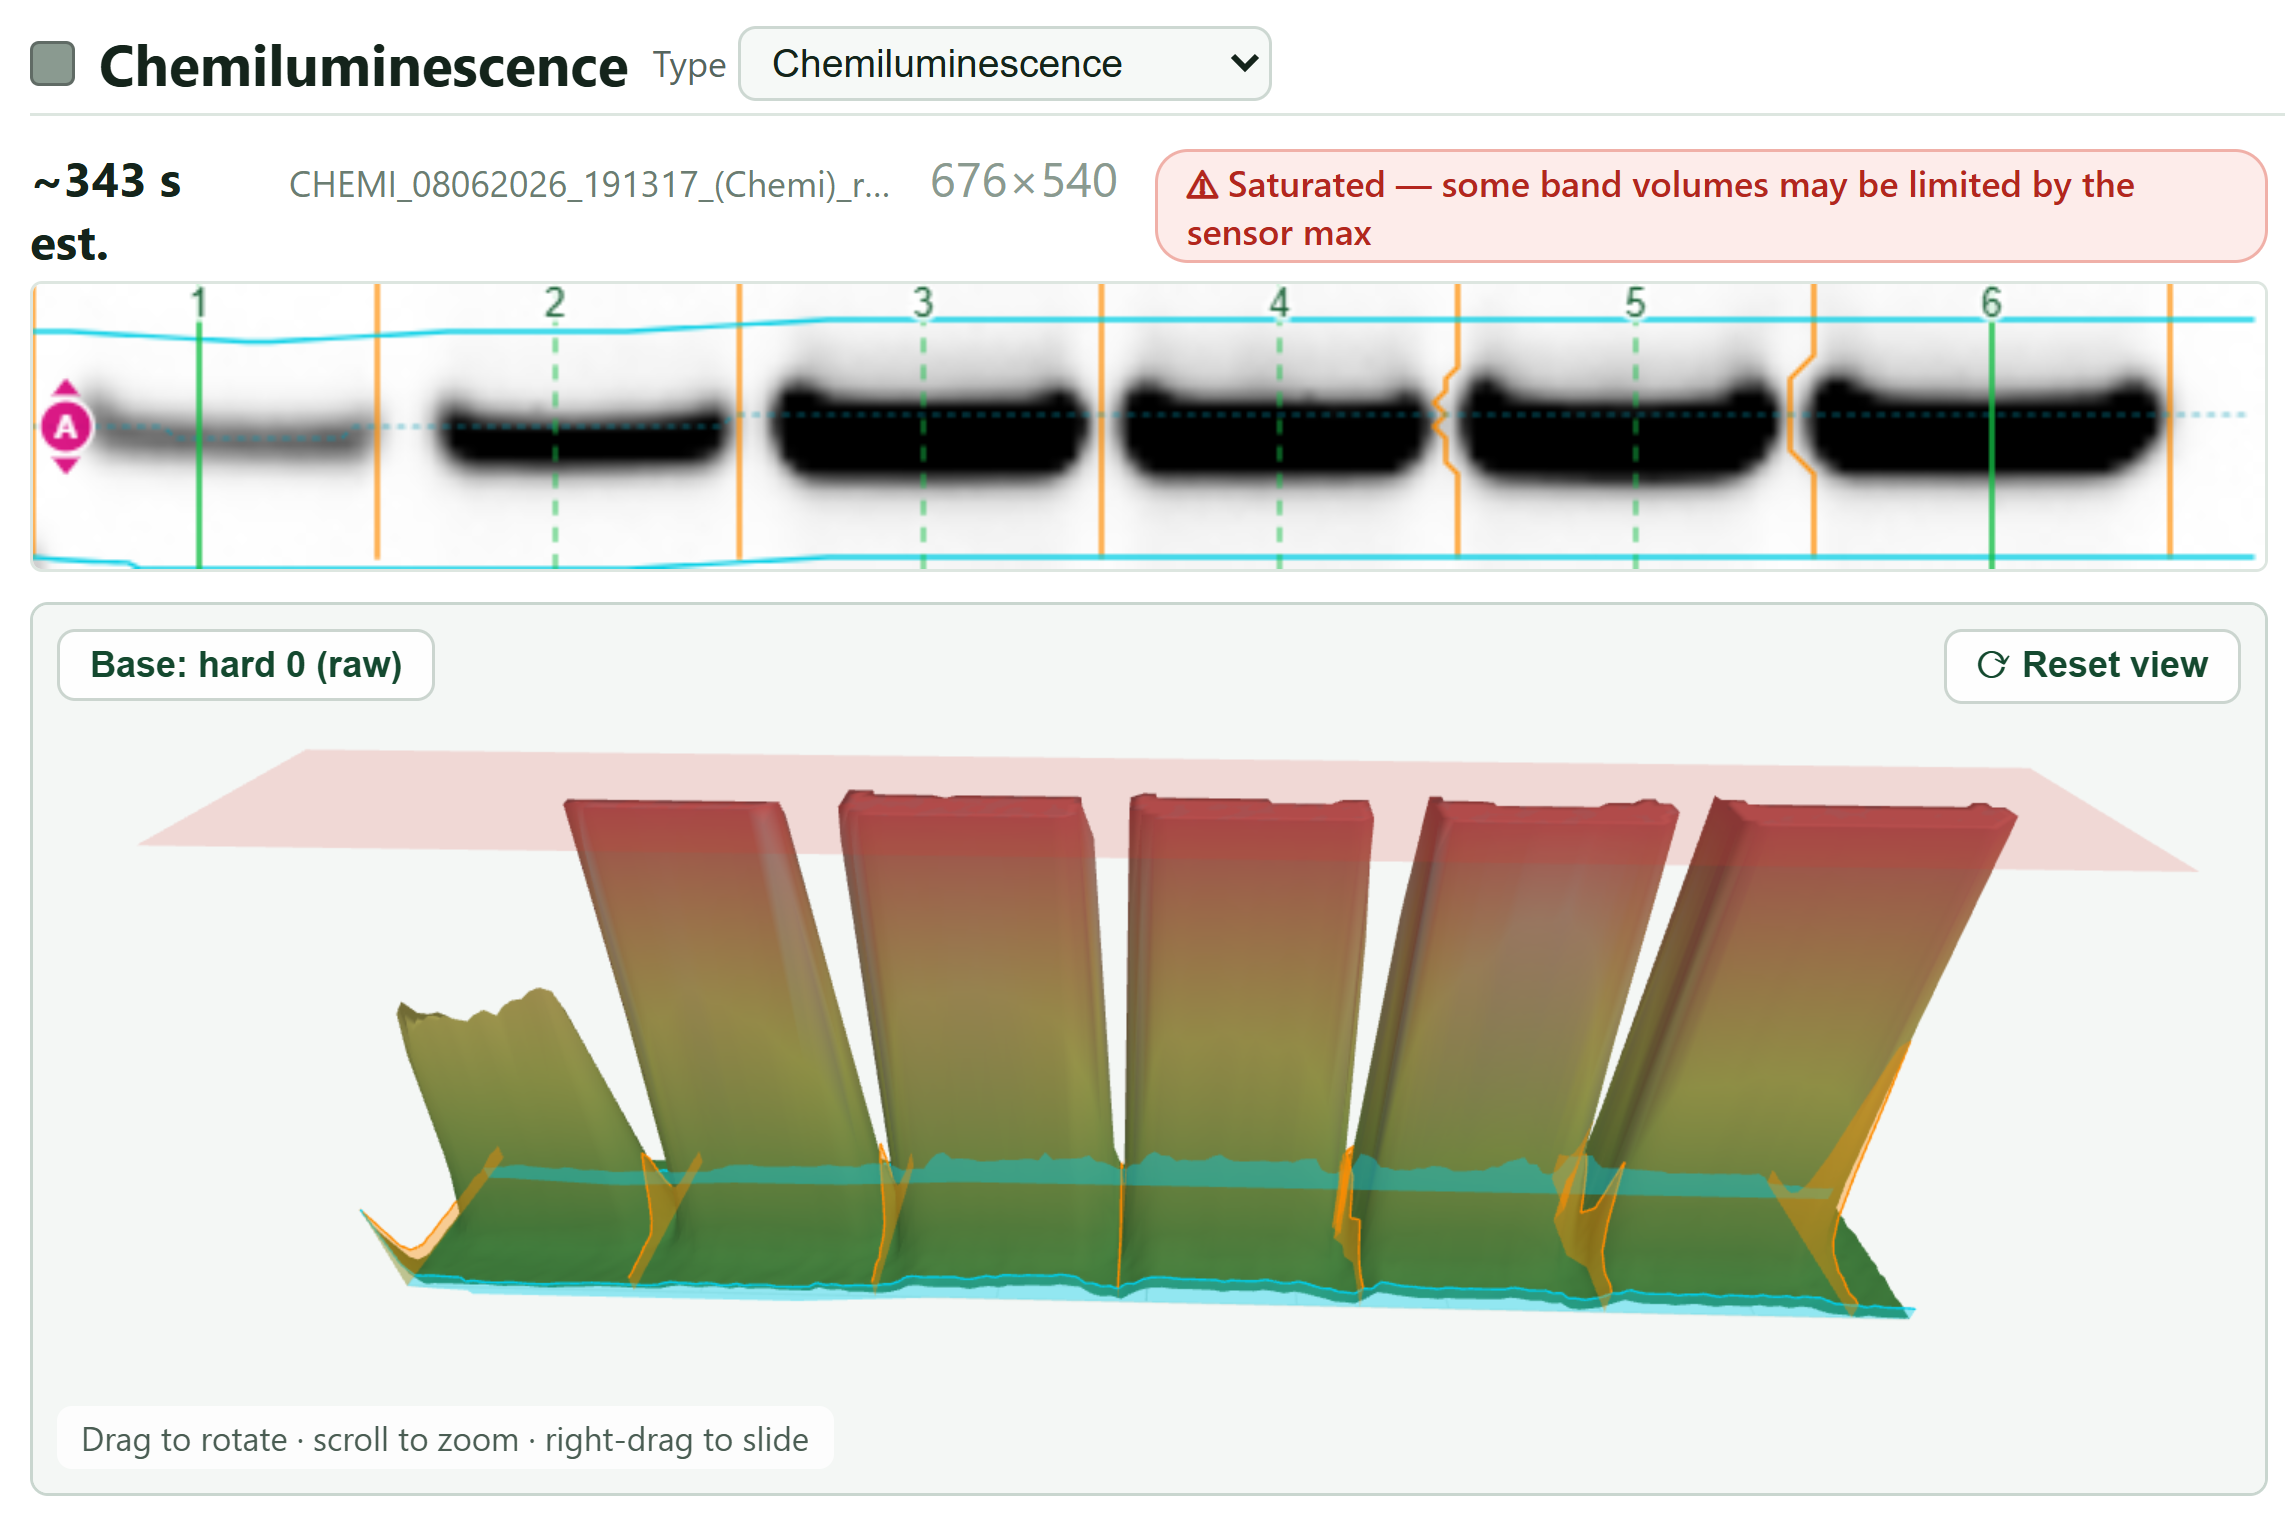
The measurement line sits a set margin above the image's own noise, the same rule on every band, strong or faint. And when a band hits the sensor ceiling, Blotto flags it and shows the saturation plane in 3-D, so a clipped value never sneaks into your figure.
You can't hand-edit a value; you only choose where to measure. That's what makes it reproducible.
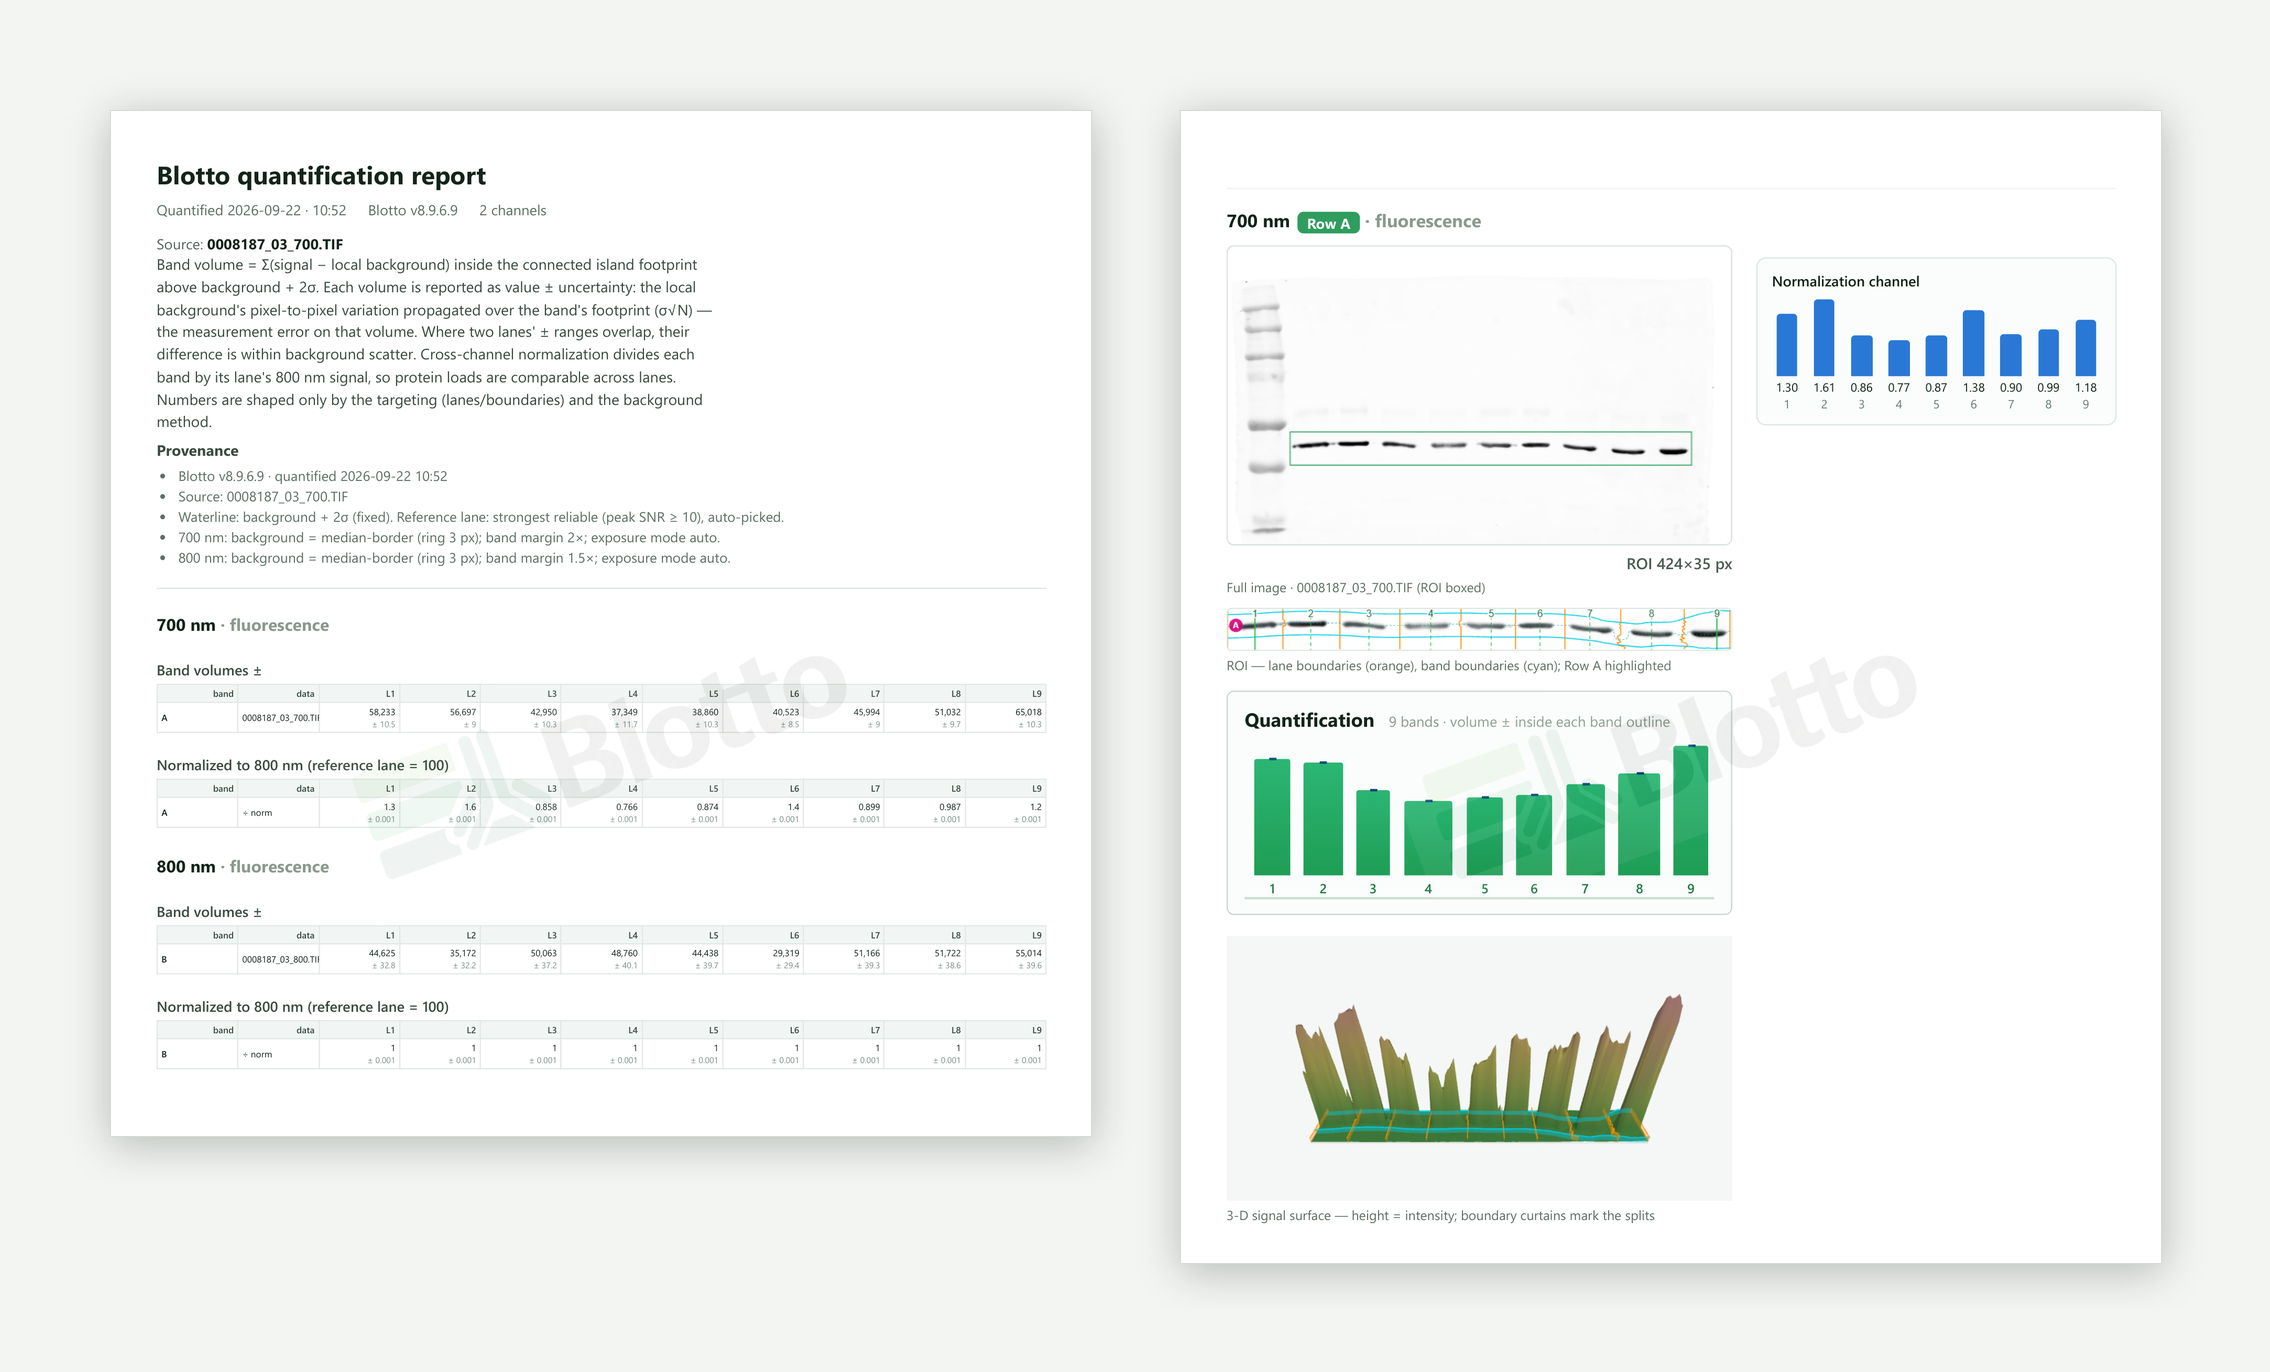
Your values and the evidence behind them, in one file, for your notebook, your PI, the methods section, or Reviewer 2.
Every band volume carries its own measurement error, taken from the local background scatter, so when two lanes' ranges overlap, you know the difference is noise. Alongside the numbers: the blot with the region boxed, the lane and band boundaries actually used, the per-band chart, the 3-D signal surface, and a provenance block listing the Blotto version, source file, background method, band margin, reference lane and normalization.
Months later, anyone in the lab, or a reviewer, can see exactly what was measured and repeat it.
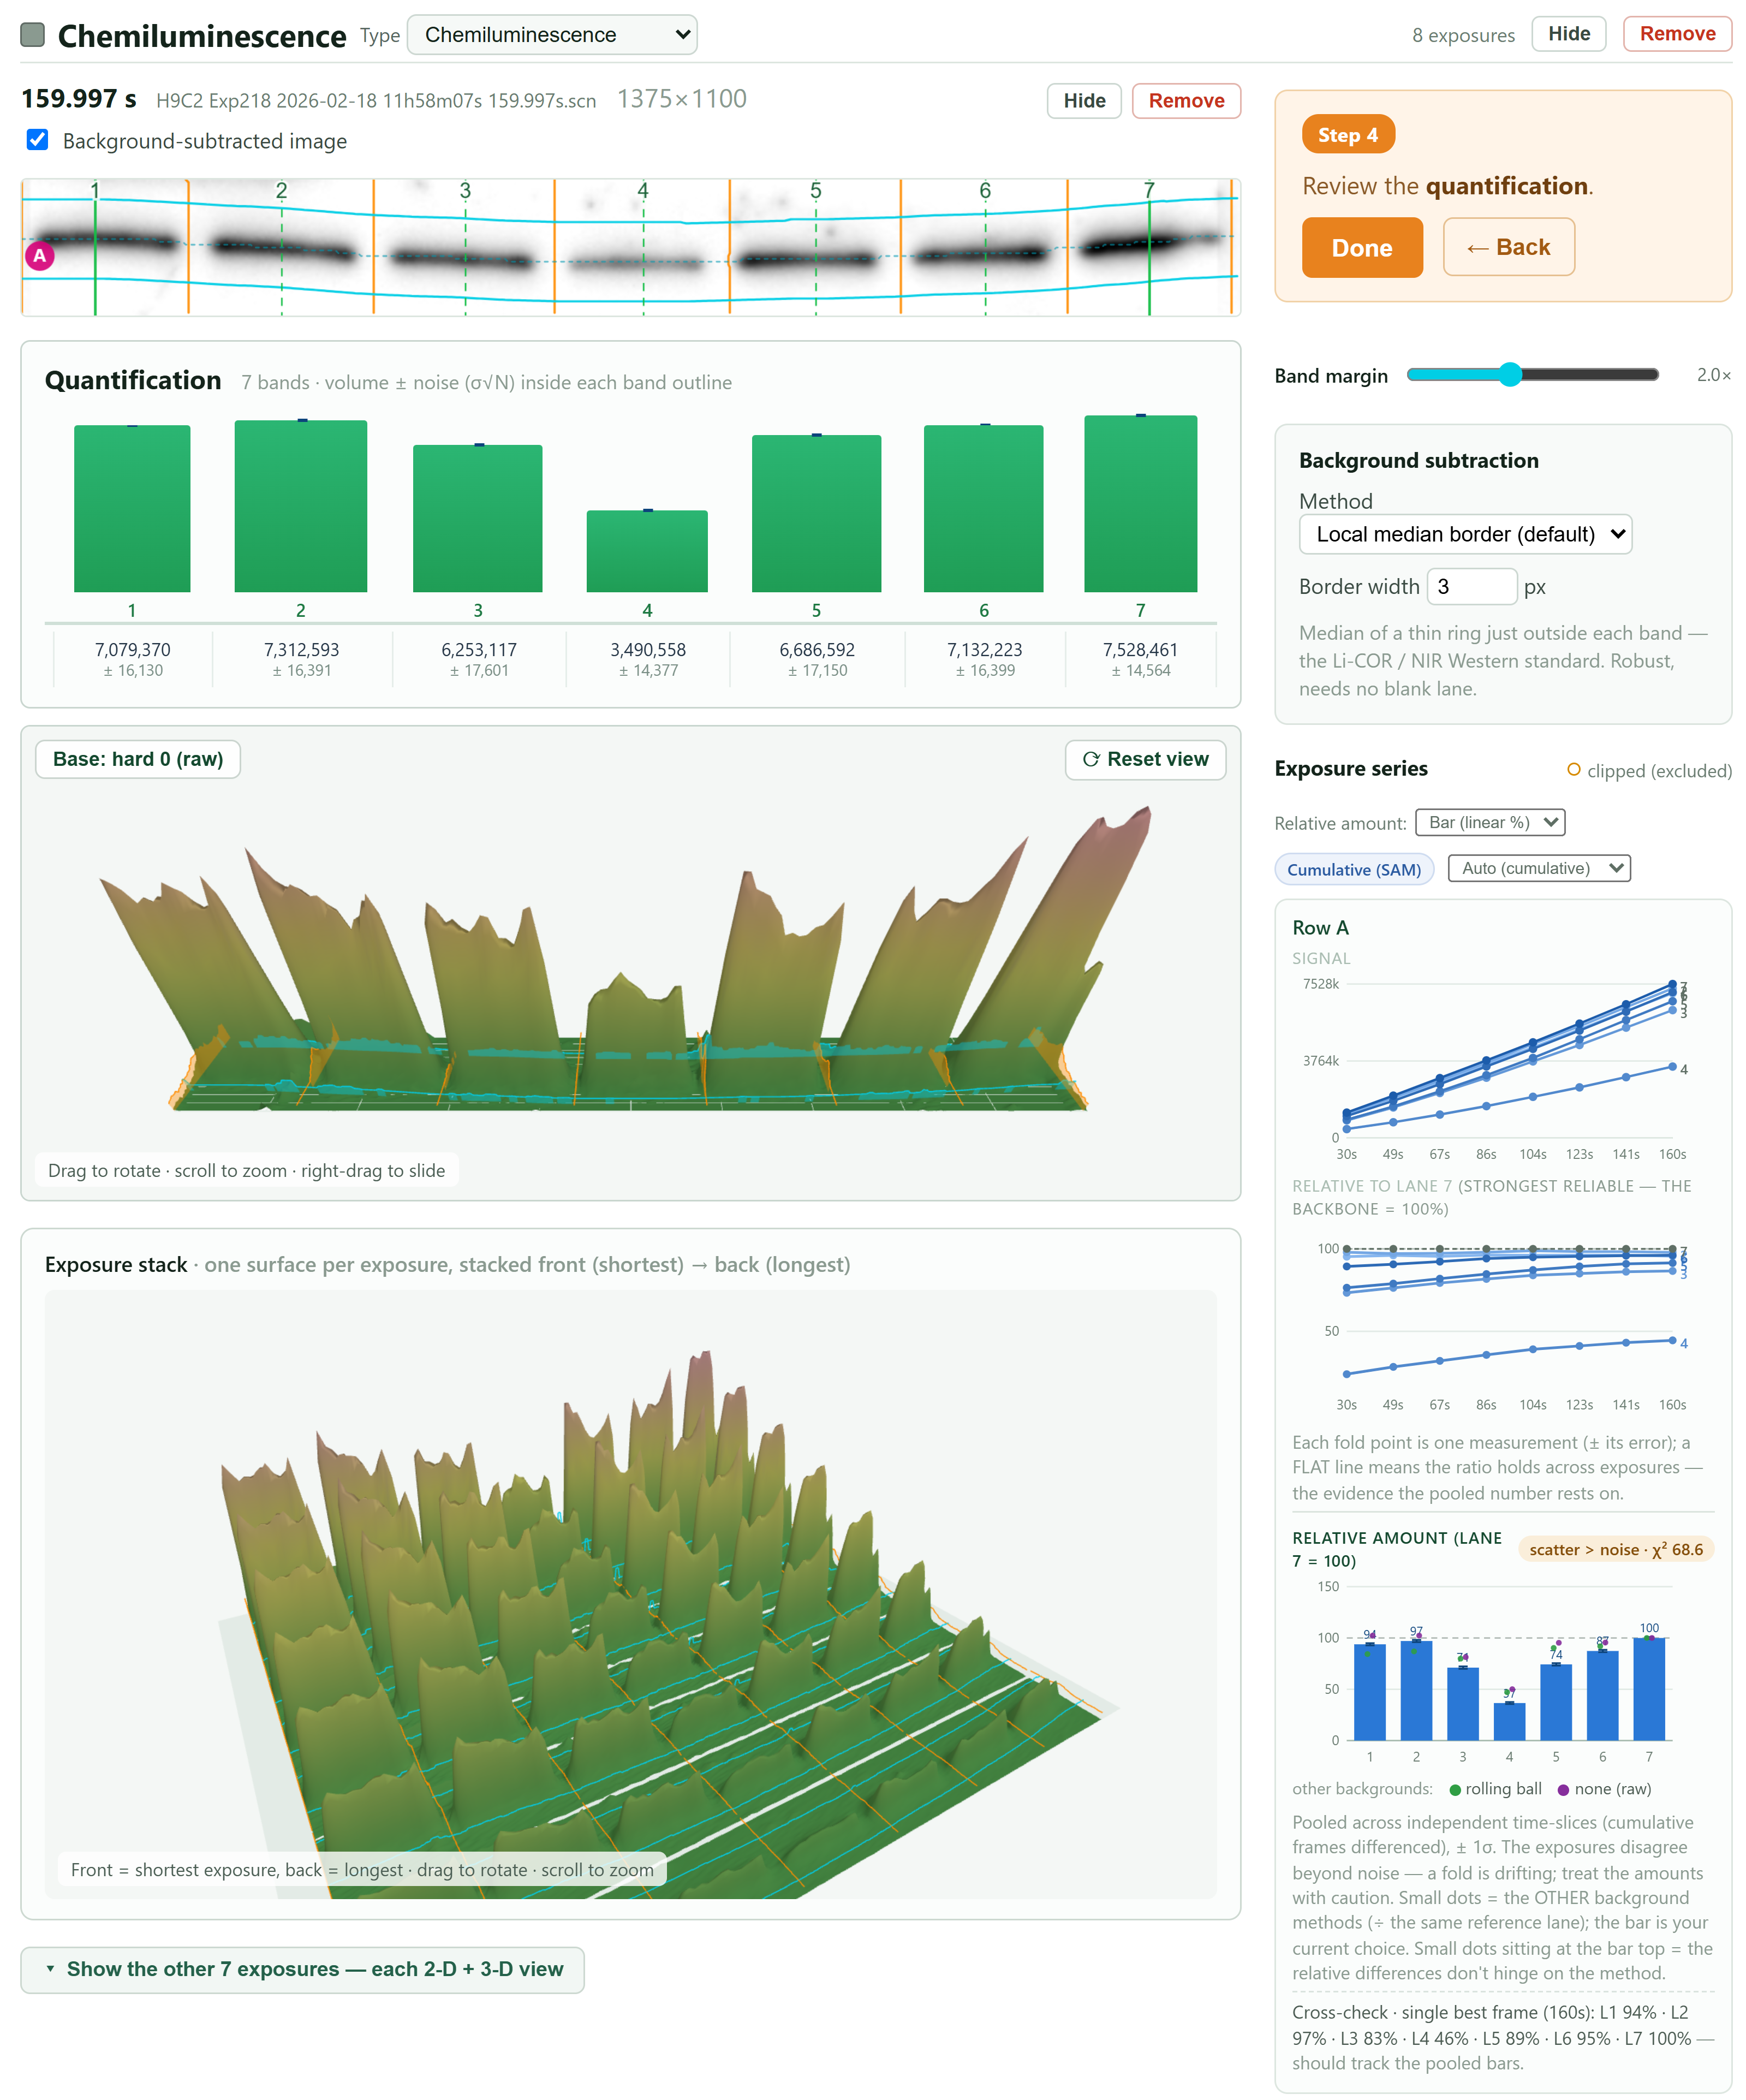
Don't cherry-pick an exposure. Blotto takes in every frame and shows the entire analysis on one screen.
The blot, the per-band volumes, the 3-D surface, the exposure-series linearity, and the pooled relative amount with its confidence interval, together, with nothing hidden in another tab. The reliable exposures pool into one number you can defend.
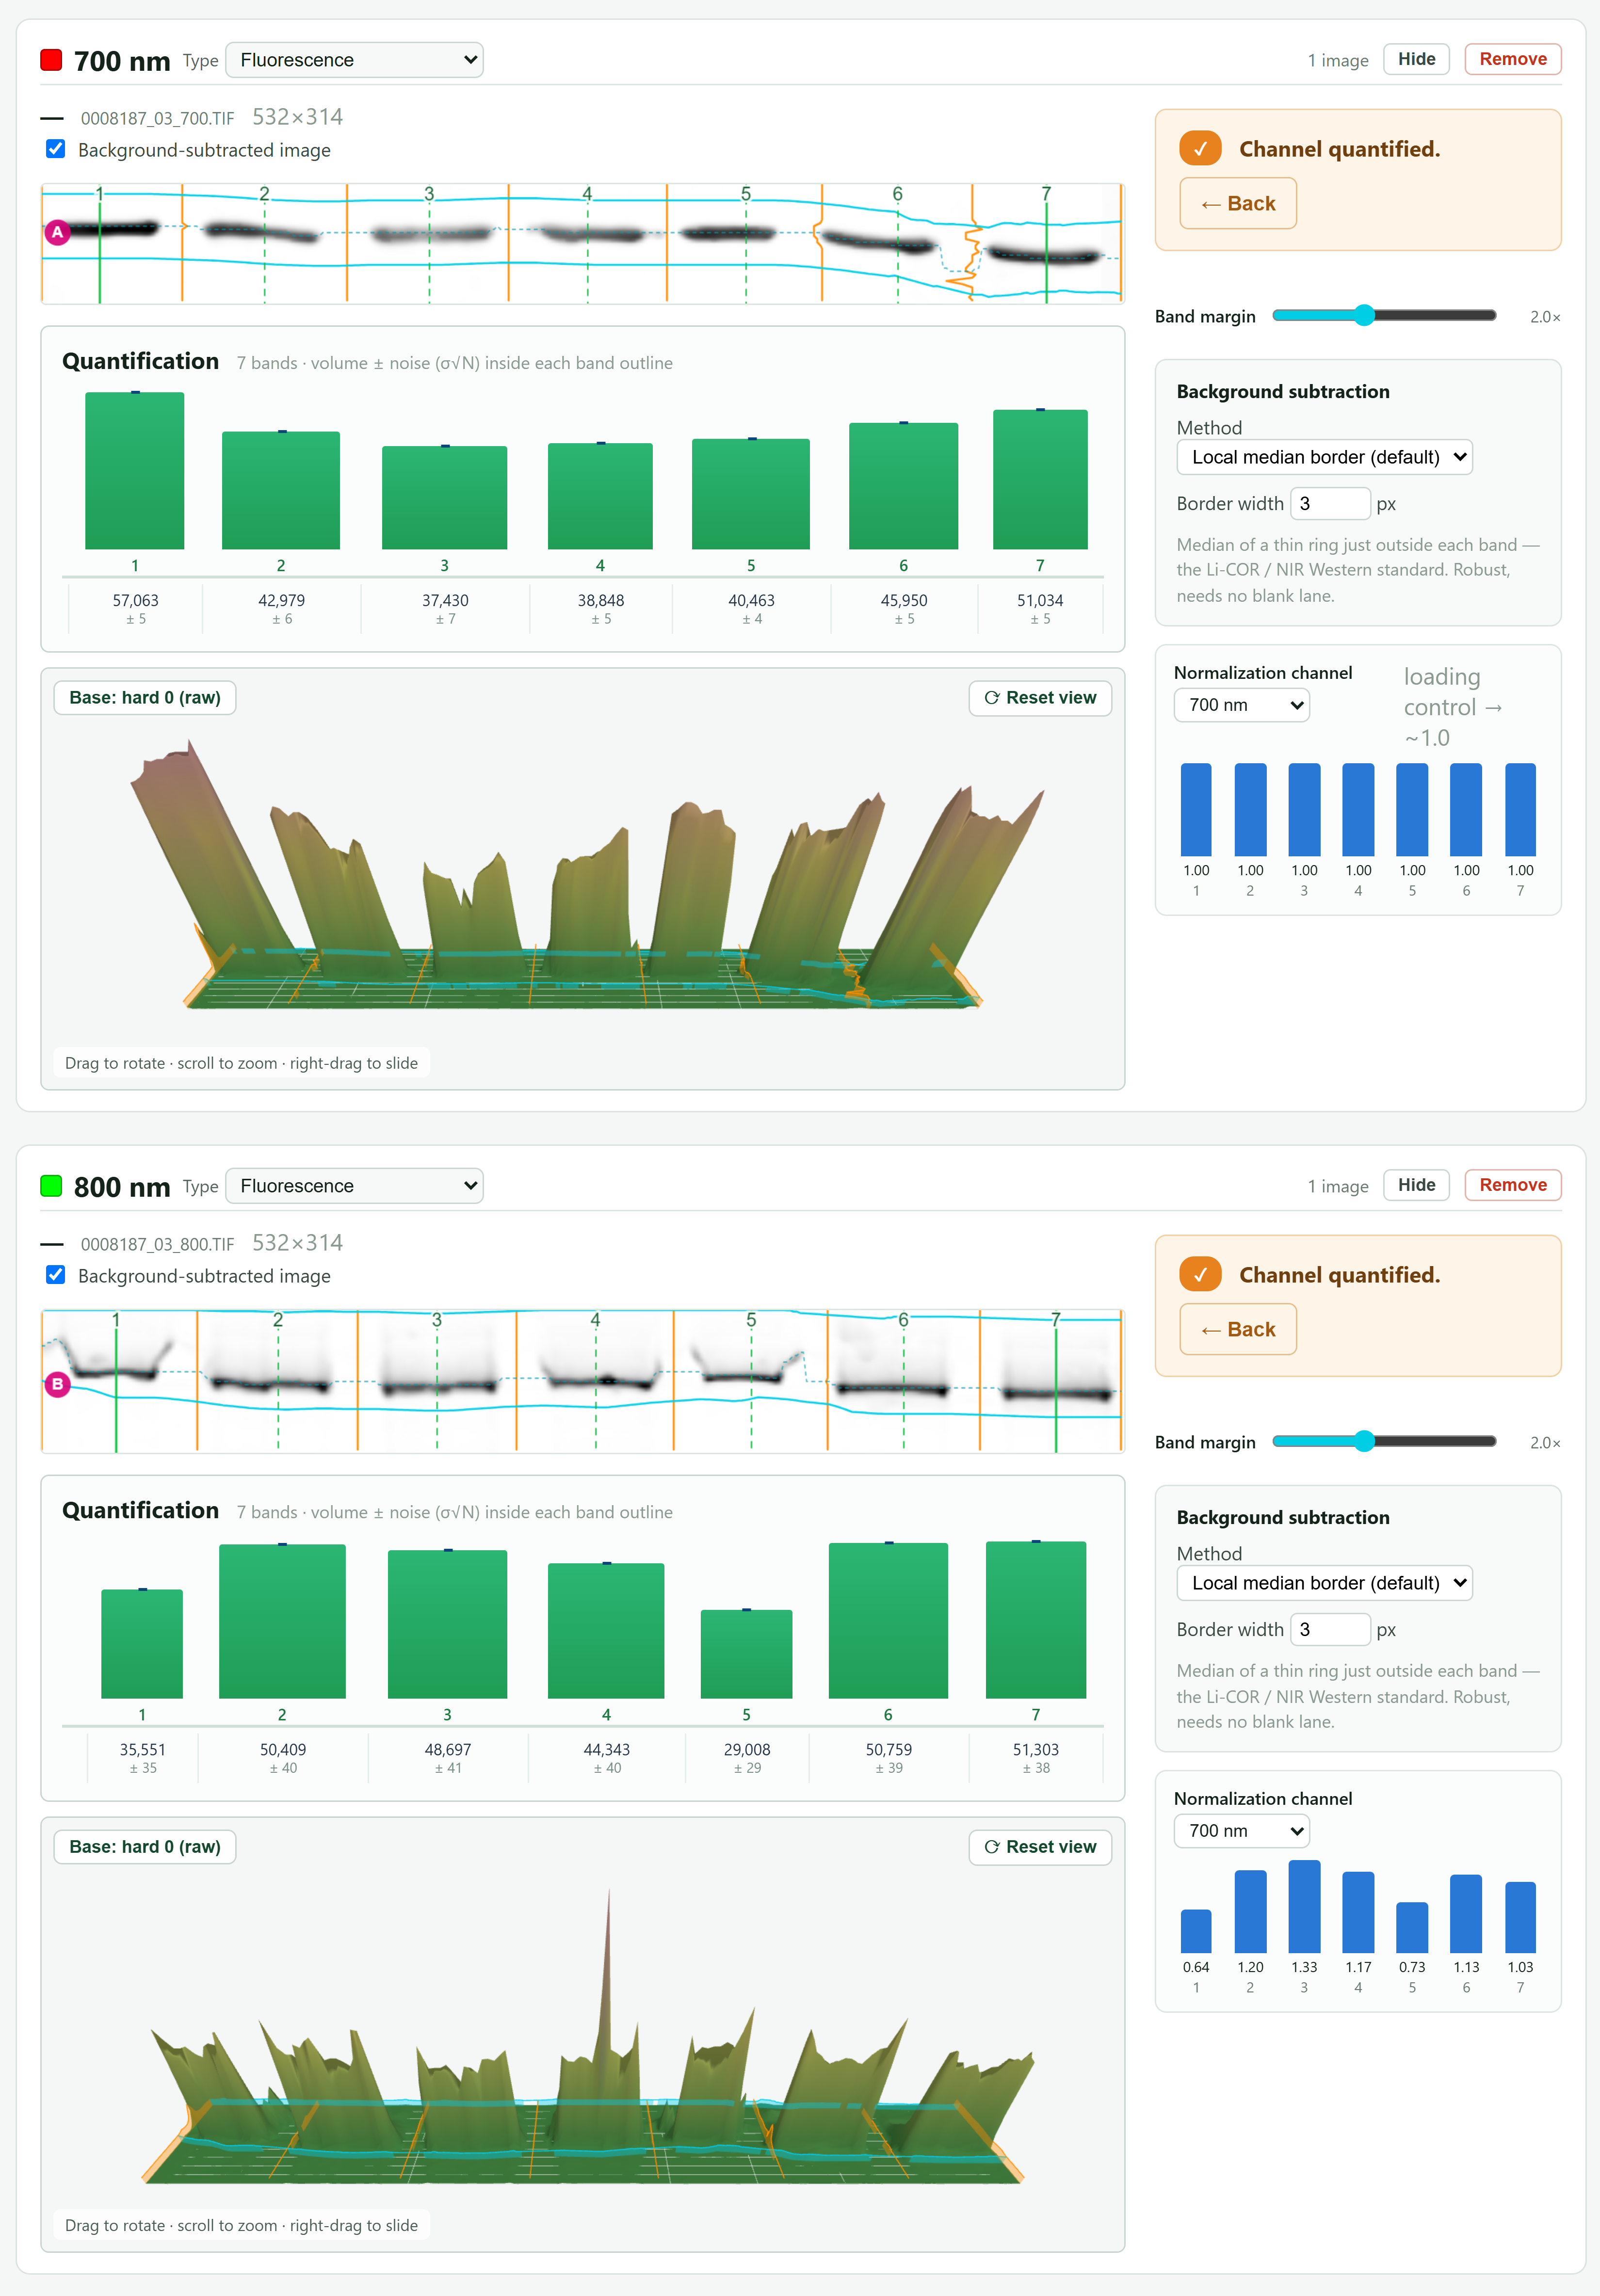
Normalize your target to a loading-control channel or to whole-lane total protein, per lane, right in the workflow, not in a spreadsheet afterward. The reference and the ratio are visible, not hidden.
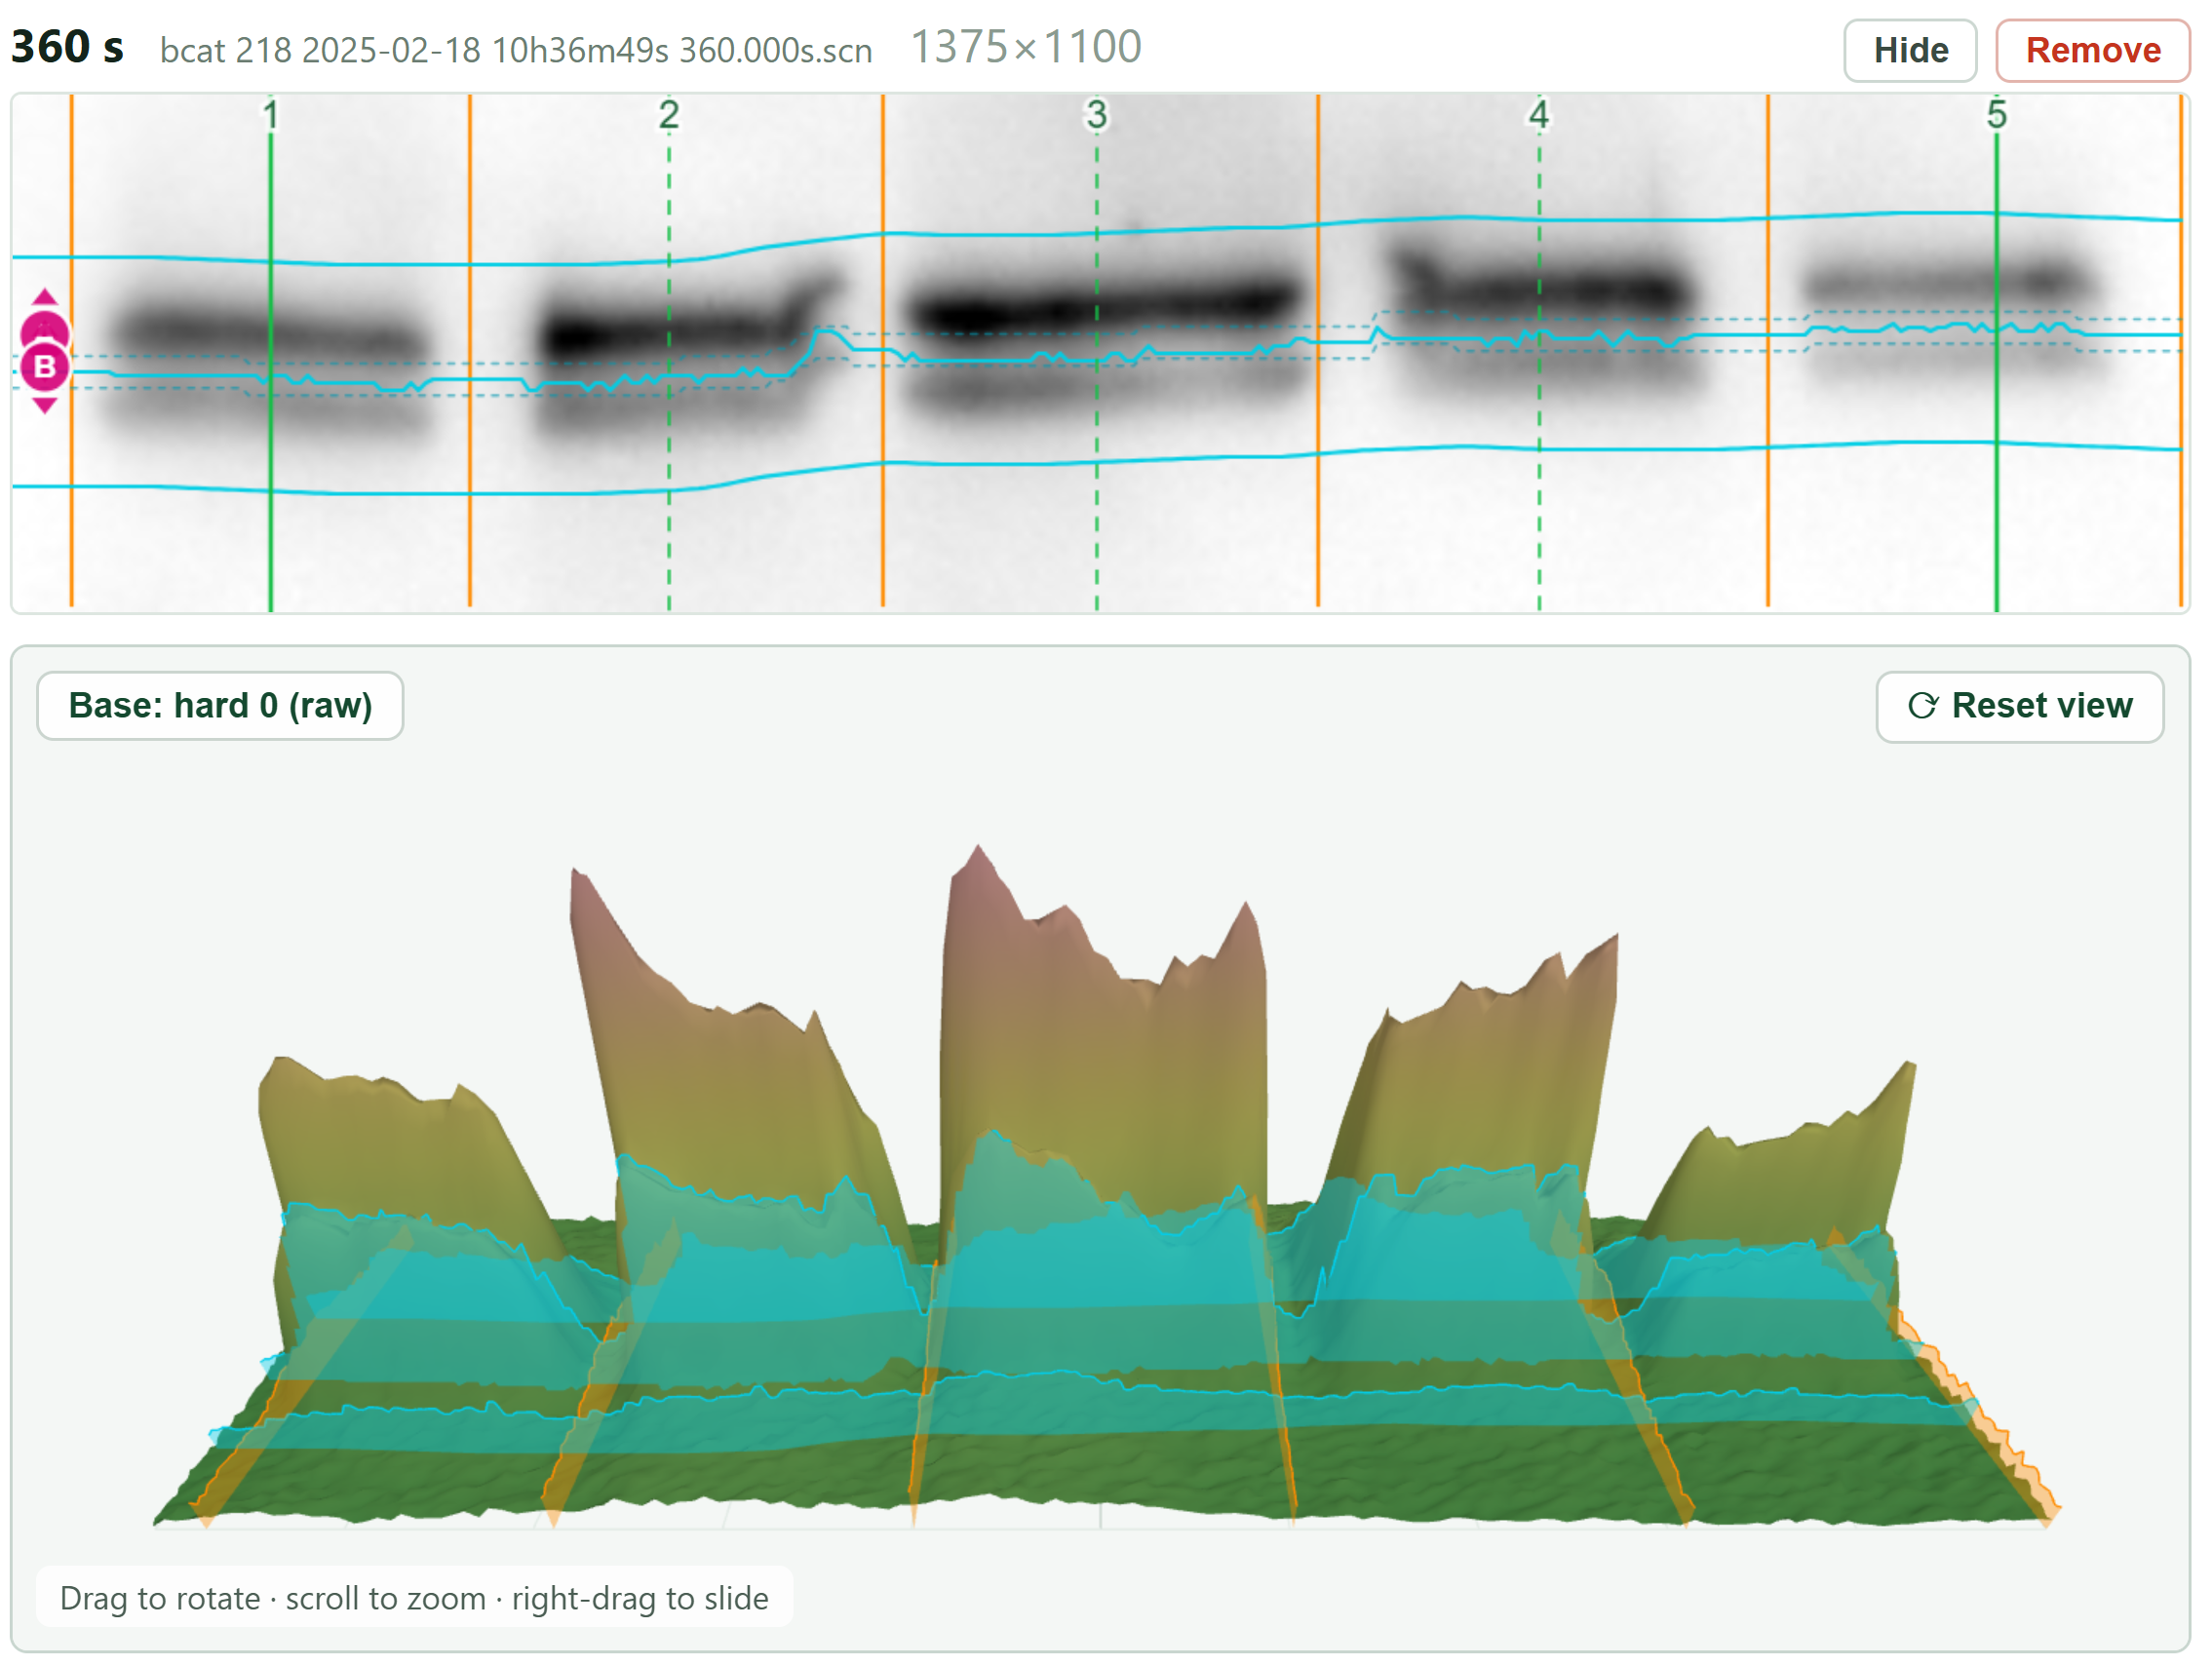
Two bands stacked in one lane? Where one ends and the next begins is exactly where a box, or a straight line, gets it wrong.
Blotto reads the signal and draws the divider along the valley between them: the real boundary, curved to follow the gel, so each band is targeted on its own. You see the split it chose, right on the image, and can nudge it before you quantify.
Any imager, any common format. It opens in your browser, and your files are never uploaded.
Mark the region, confirm the lanes, click the bands. (Load your immunoblot in the standard orientation.)
Blotto measures each band's real footprint above the noise, and shows the pixels it counted.
Your numbers plus a record of how they were made, ready for the figure and the methods.
The PI owns the subscription. Everyone else signs in with their own email. No shared logins, no passwords.
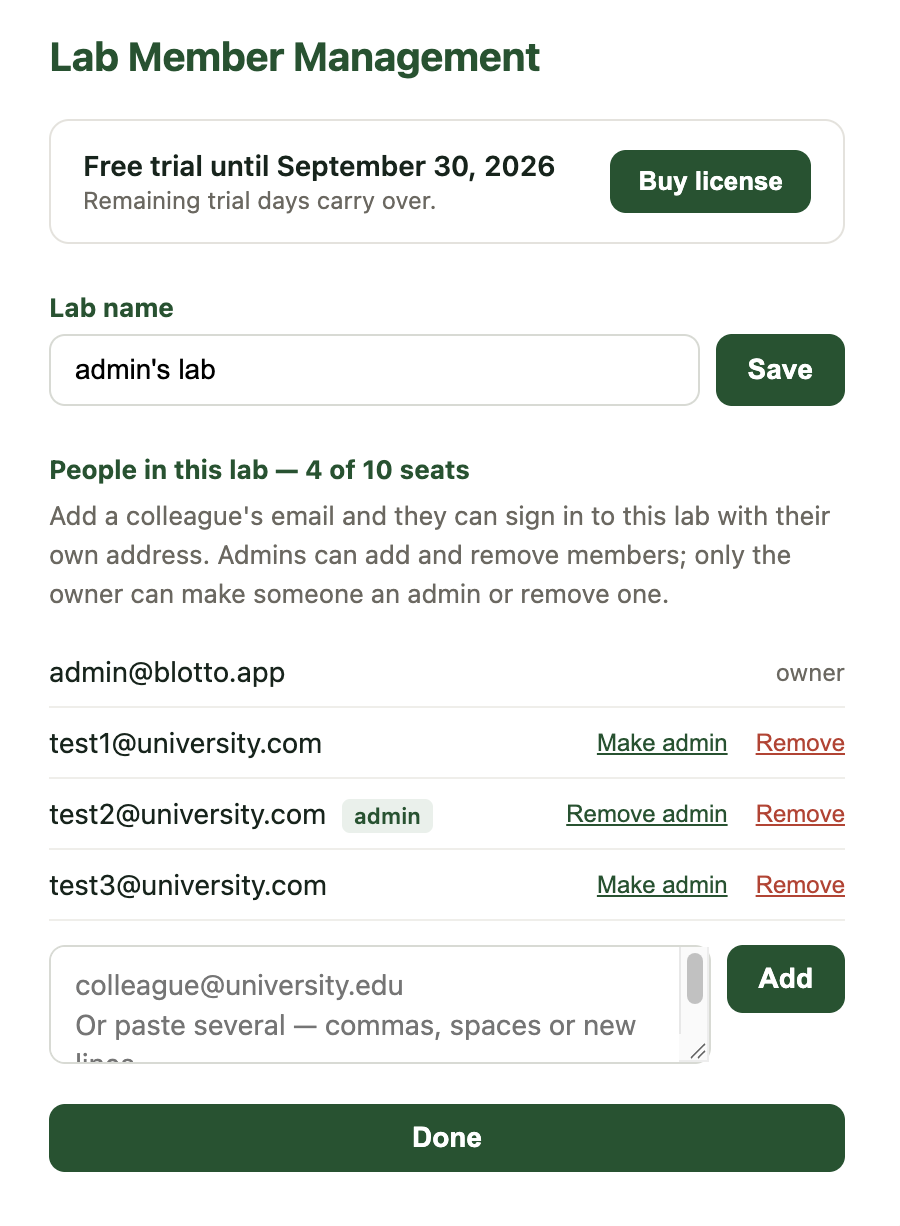
Add lab members by email, or paste a whole list at once. Make a postdoc or lab manager an admin and they can add and remove people too. When someone rotates out or graduates, remove them and the seat is ready for whoever comes next.
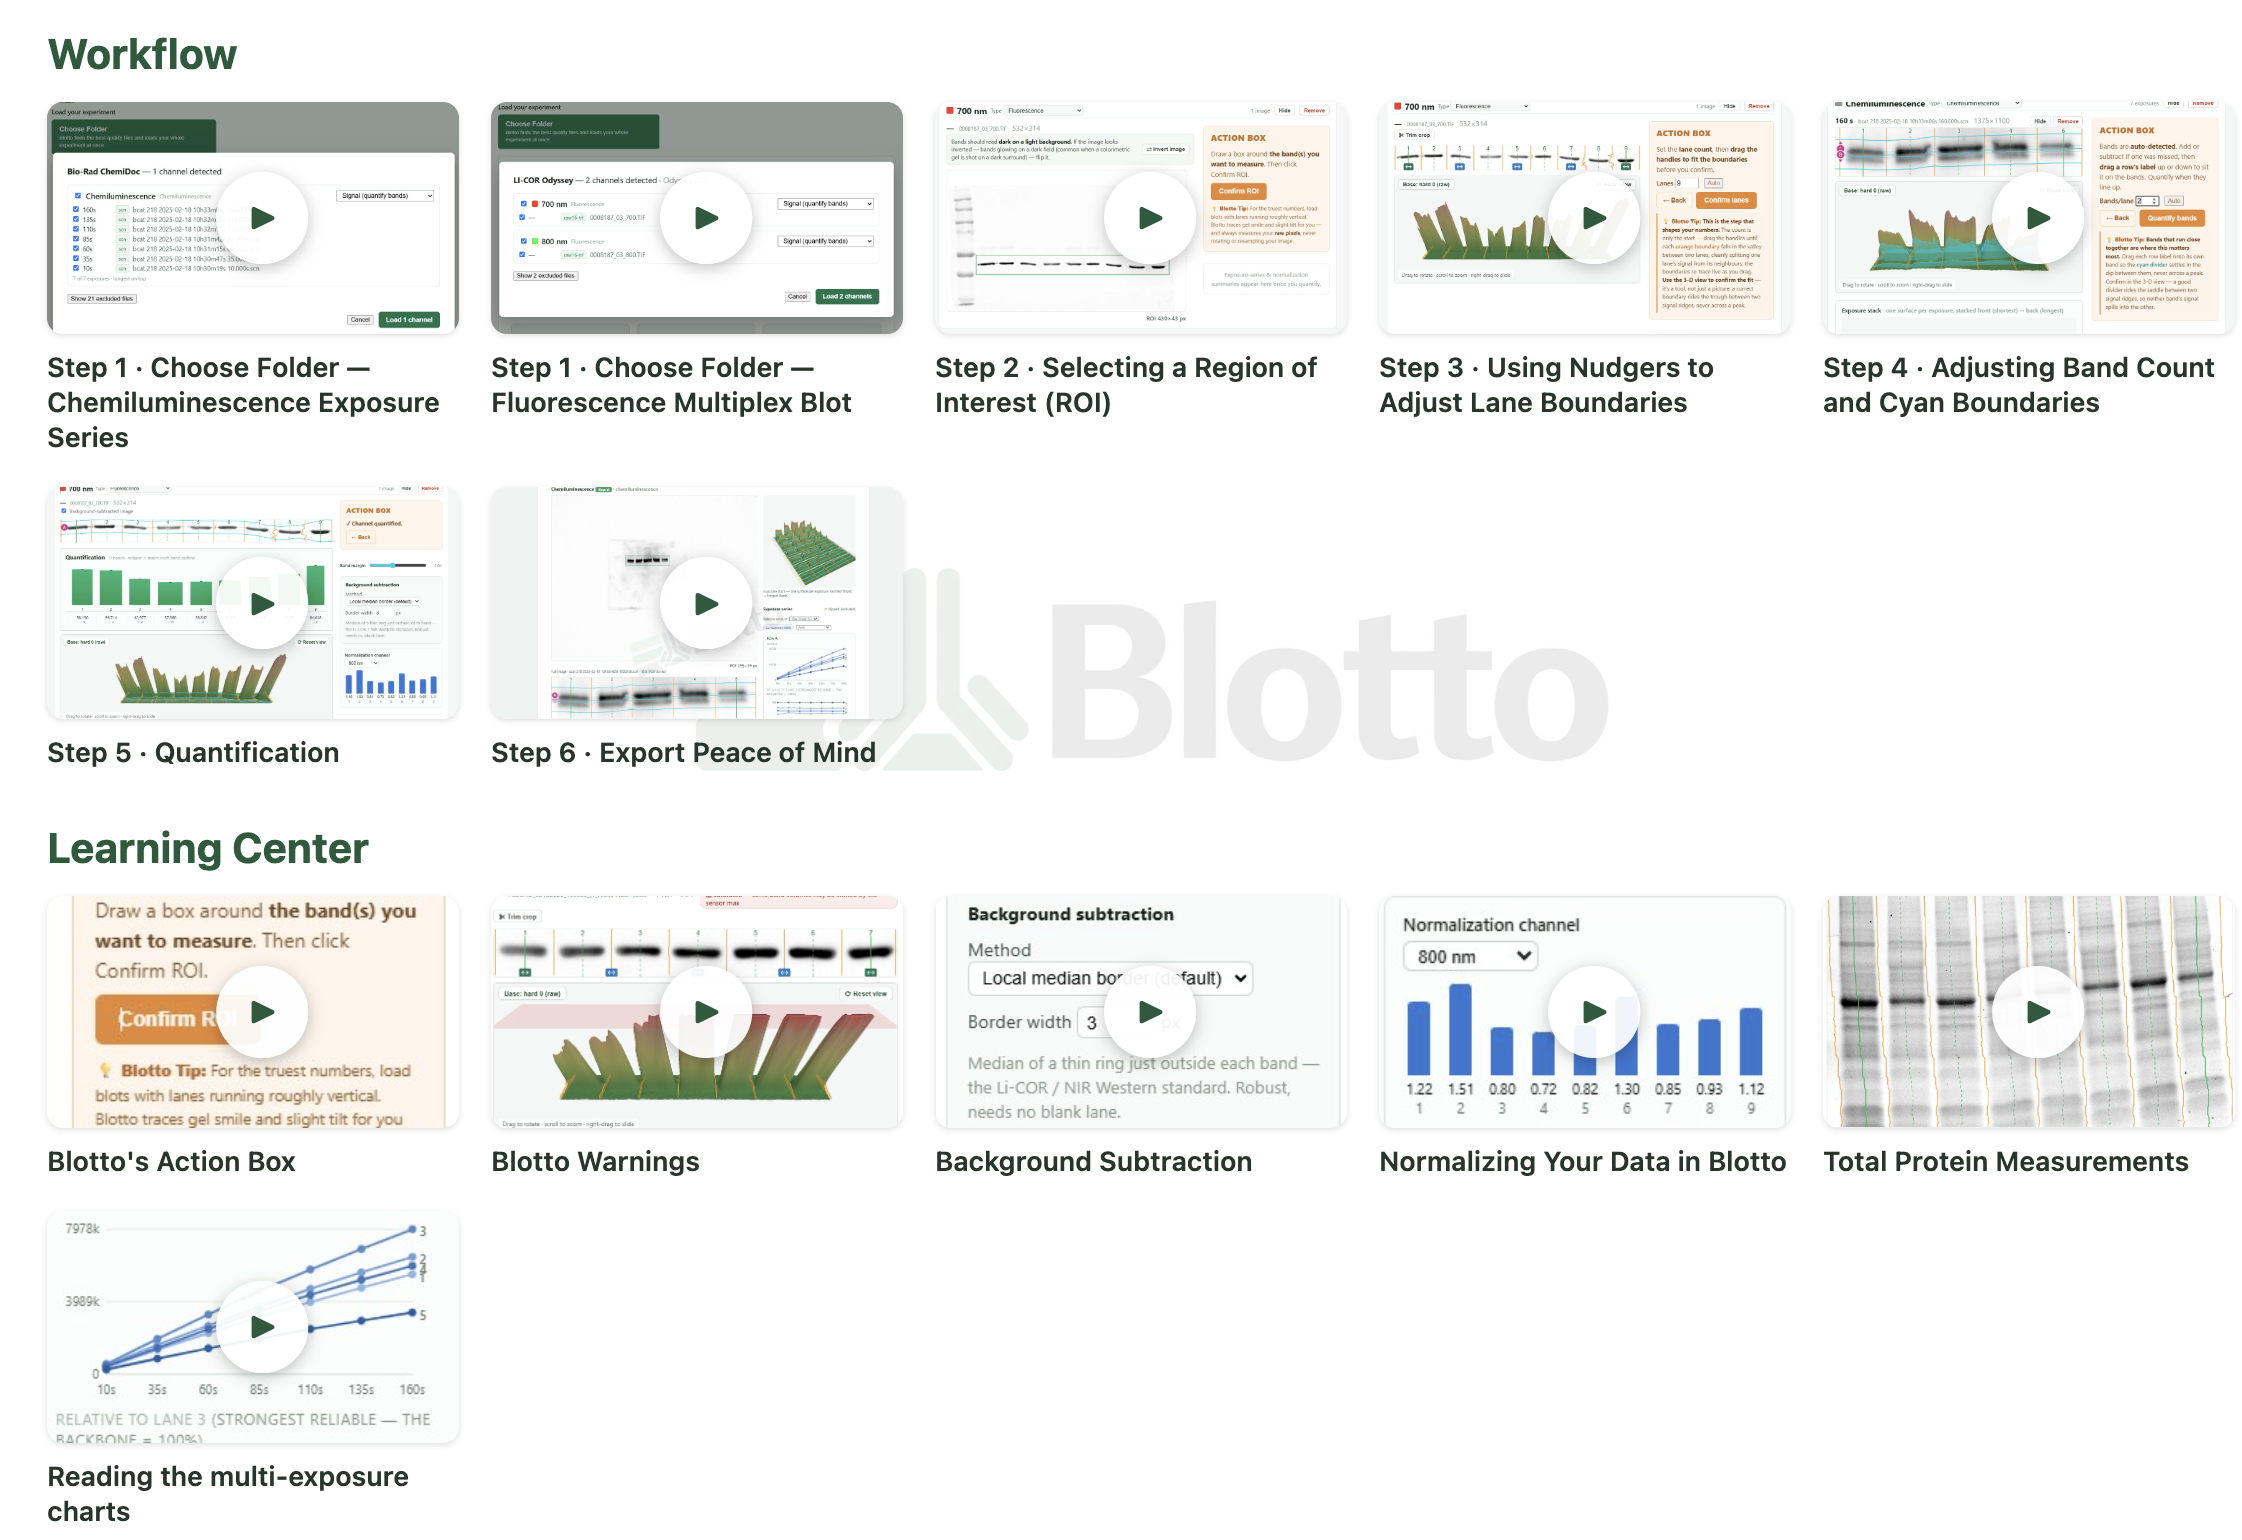
Every step of the workflow has a short video inside Blotto: loading your files, setting the region, lanes and bands, quantifying, exporting.
A learning center covers the method underneath: background subtraction, normalization, total protein, and reading a multi-exposure series. When a rotation student or new tech starts, send them to the videos instead of spending an afternoon at the bench with them, and everyone in the lab quantifies the same way.
Every plan covers up to 10 people for 12 months, with unlimited blots. Pick how much help you want getting everyone quantifying the same way.
For labs ready to dive in on their own.
Renews at $119 / year
Get your whole lab set up right from day one.
Then $119 / year
For labs with students and techs rotating through all year.
Renews at $299 / year
Unusual or complicated blot? We'll work through it with you and tailor Blotto to your specific issue. Works with any plan.
✓ If we can't help, you don't pay.
Several labs, more than 10 people, or paying by purchase order? We'll send a quote.
No card needed for the trial, and any trial days left carry over when you buy. Plans don't renew automatically; we email you before yours ends. Purchases are final, so please use the trial to decide. Complex Blot Support is the exception: if we can't help, we refund it. Terms · Privacy
Reproducible immunoblot numbers you can put in a paper and defend to a reviewer.
14 days, full access. Sign in with your email and we'll send you a link, no password to remember. It comes from admin@blotto.app; if it isn't in your inbox within a minute, check spam or junk and mark it Not spam.
Blotto is an independent product, not affiliated with, endorsed by, or sponsored by any imaging-system vendor. Bio-Rad, ChemiDoc, Image Lab, Invitrogen, iBright, LI-COR, Odyssey, Azure, Amersham, Syngene, and other product names are trademarks of their respective owners, referenced only to describe file-format compatibility.
Blotto runs in your browser, and your image files are never uploaded. Only the unlabeled region of interest you select, with no sample names, filenames, or identifying metadata, is sent to the Blotto server to run the analysis. Nothing is stored on our servers.